A Visual Guide to Growing Your Money
Start with $10,000. Add $500 every month. Wait 30 years. You'll have $691,150 — and $501,000 of that is money you never contributed. It was earned by your money, working on its own.
That's compound interest: earning returns on your returns, not just on what you put in. This guide walks through our Compound Interest Calculator step by step, so you can see exactly how the math plays out and run your own numbers.
What Is Compound Interest?
Simple interest pays you only on your original deposit. Compound interest pays you on your original deposit plus all the interest you've already earned. The difference is small at first, but over decades it's enormous.
Think of it as a snowball rolling downhill. At the top, it's small and slow. But each rotation adds more snow, which means the next rotation adds even more. By the bottom of the hill, it's massive — and most of its size came from the second half of the trip. Compound interest works the same way: the last 10 years of a 30-year investment typically generate more growth than the first 20 combined.
Setting Up Your Numbers
The calculator takes six inputs. Here's what the defaults look like and why they make a reasonable starting point:
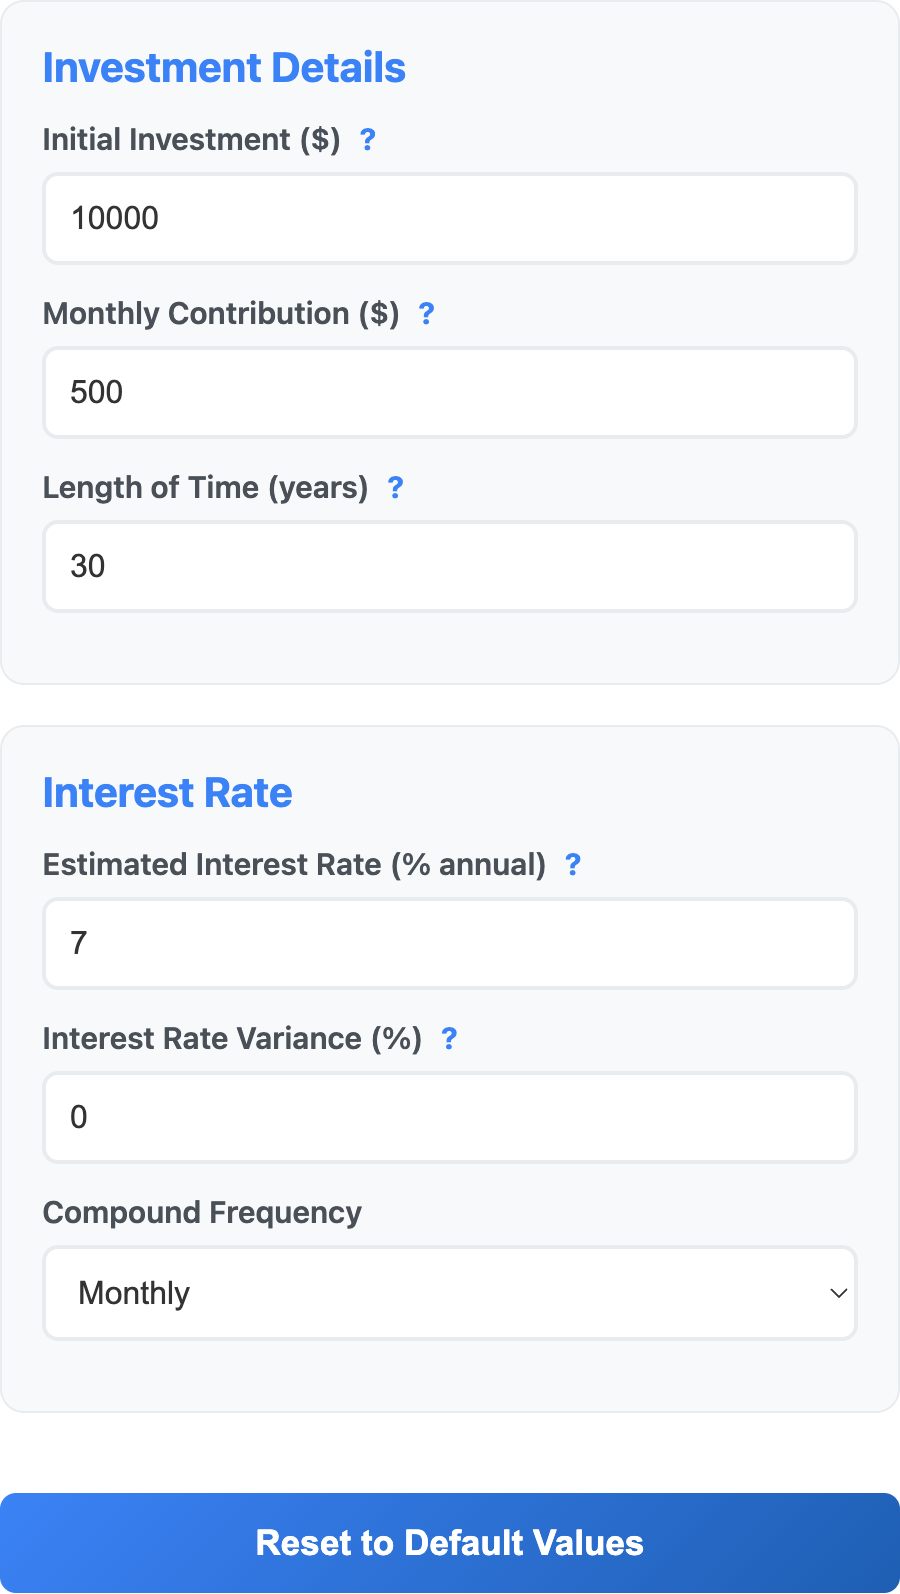
- Initial Investment ($10,000) — Your starting lump sum. Could be savings, an inheritance, or a rollover.
- Monthly Contribution ($500) — What you add each month. This is where most of your future wealth comes from.
- Length of Time (30 years) — Your time horizon. Roughly the span from age 30 to 60.
- Interest Rate (7%) — Average annual return. 7% is the inflation-adjusted historical average for a diversified stock portfolio.
- Variance (0%) — Adds optimistic/pessimistic bands. We'll turn this on later.
- Compound Frequency (Monthly) — How often interest is calculated. Monthly is standard for most investments.
How much does the monthly contribution matter? More than anything else:
| Monthly Contribution | 30-Year Value |
|---|---|
| $0 | $81,165 |
| $200 | $324,559 |
| $500 | $691,150 |
| $1,000 | $1,301,135 |
Going from $0/month to $500/month multiplies your ending balance by 8.5x. The initial $10,000 matters, but the monthly habit is what builds real wealth.
Reading Your Results
After entering your numbers, the calculator shows a banner with your future value and a summary card breaking down where the money comes from:
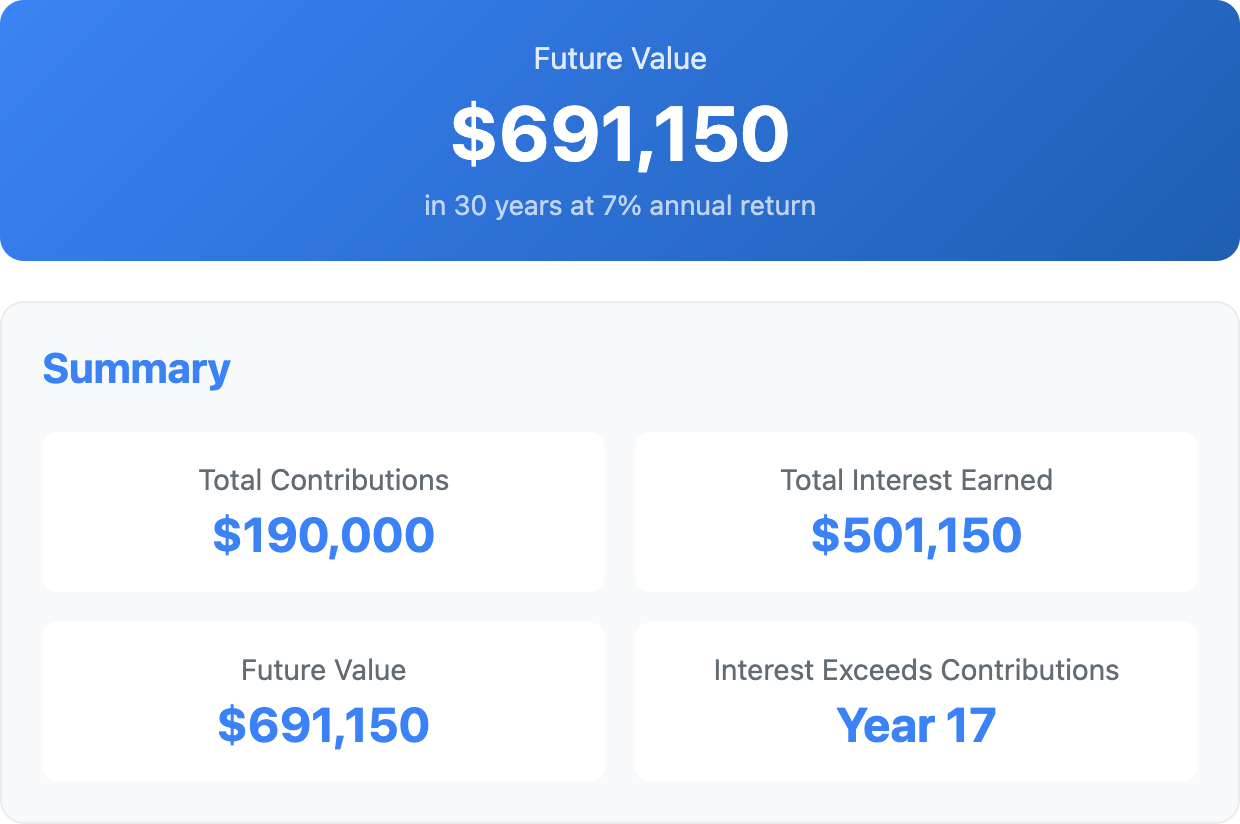
The key numbers:
- Total Contributions ($190,000) — The money you actually put in: $10K initial + $500/month × 360 months.
- Total Interest Earned ($501,150) — The money your money earned. This is 72% of the final balance — nearly three dollars of interest for every dollar you contributed.
- Interest Exceeds Contributions (Year 17) — The year when cumulative interest overtakes cumulative contributions. After this point, compounding is doing more of the work than you are.
The Growth Chart
The chart shows three areas stacked together: your total balance (dark blue line), cumulative interest earned (shaded blue), and cumulative contributions (light blue). The shape tells the whole story — a hockey stick curve where growth accelerates over time.
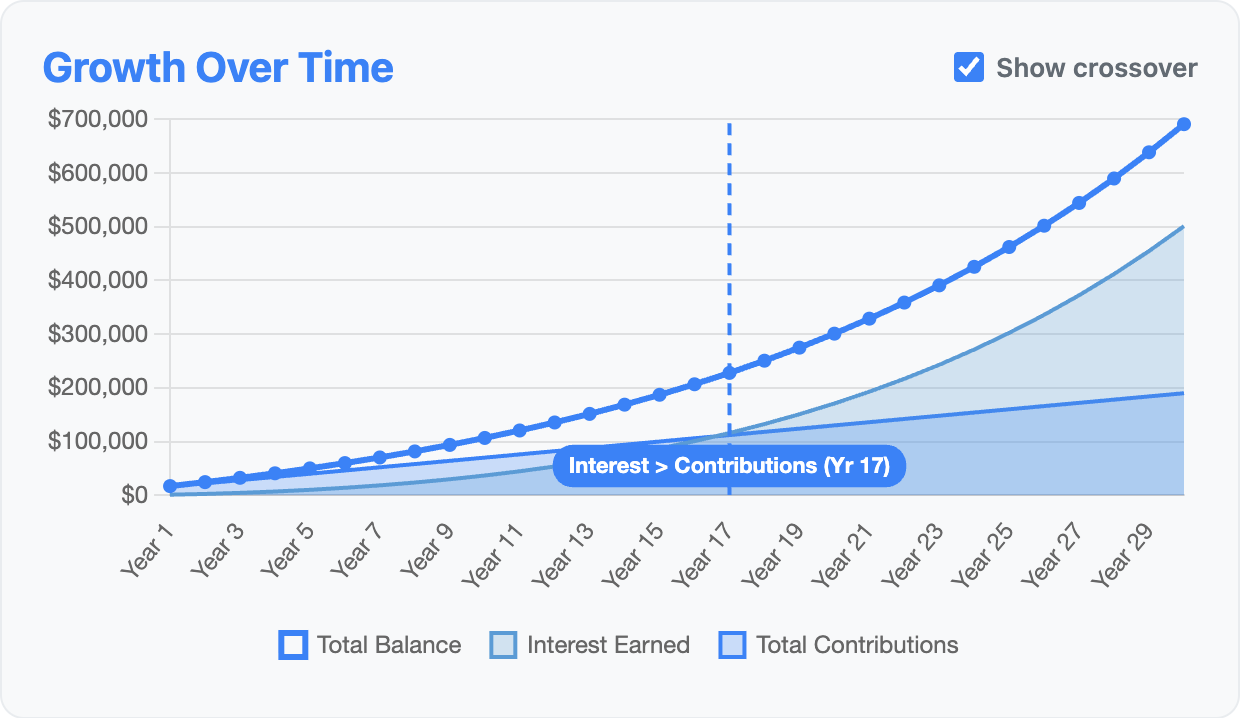
Notice the dashed vertical line at Year 17 labeled "Interest > Contributions." To the left of that line, the light blue area (your contributions) is larger than the medium blue area (interest). To the right, interest dominates. This is the crossover point — the moment your money truly starts working harder than you do.
The gap between the lines widens every year. In Year 1, you earn $919 in interest. By Year 30, you earn $46,374 in a single year — more than 7 months of contributions. That's the compounding snowball in action.
Planning for Uncertainty: Variance Bands
No investment earns exactly 7% every year. Real returns bounce around. Setting the variance to 2% shows what happens if your actual average lands at 5% (pessimistic) or 9% (optimistic):
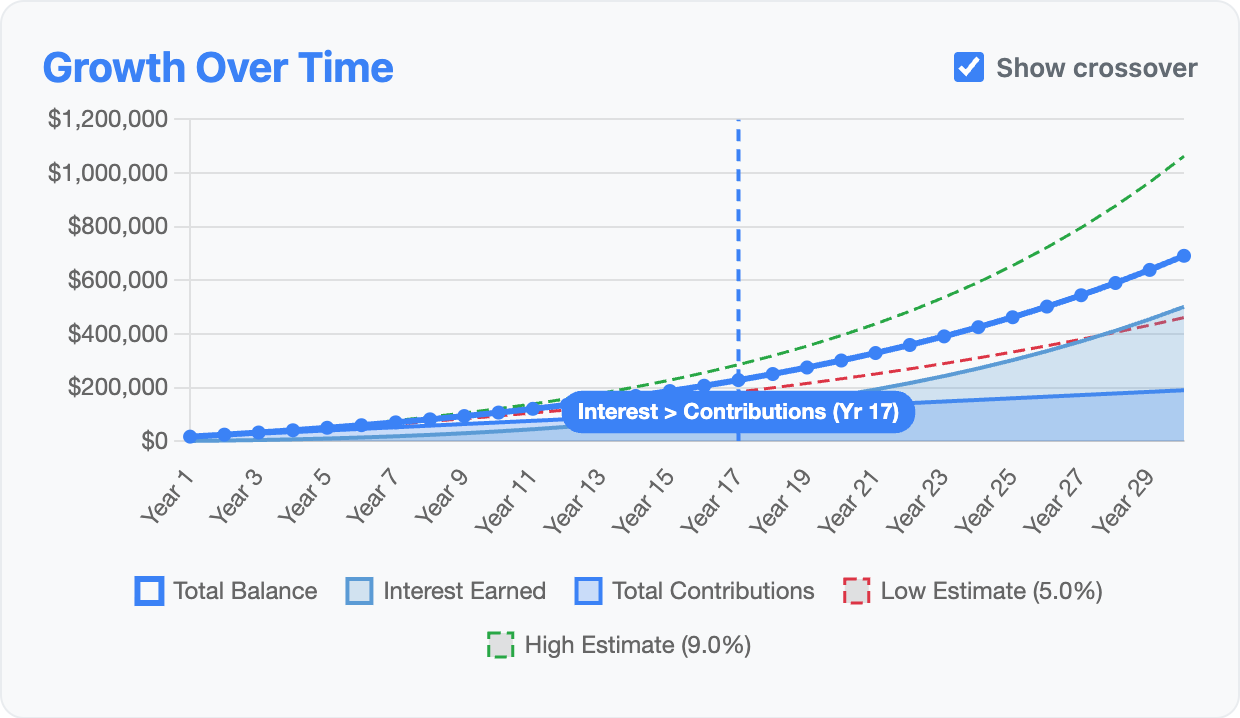
At 5% you end up around $460,000. At 9%, you're over $1,000,000. Same contributions, same timeframe — just 4 percentage points of difference in average return creates a 2x spread in outcomes.
This is the real planning value of the variance feature. If even the low estimate meets your goal, you're in a strong position. If you need the high estimate to make things work, you might want a longer timeline or higher contributions as a safety margin.
Year-by-Year Breakdown
The breakdown table shows exactly what happens each year: starting balance, contributions, cumulative contributions, interest earned, and ending balance.
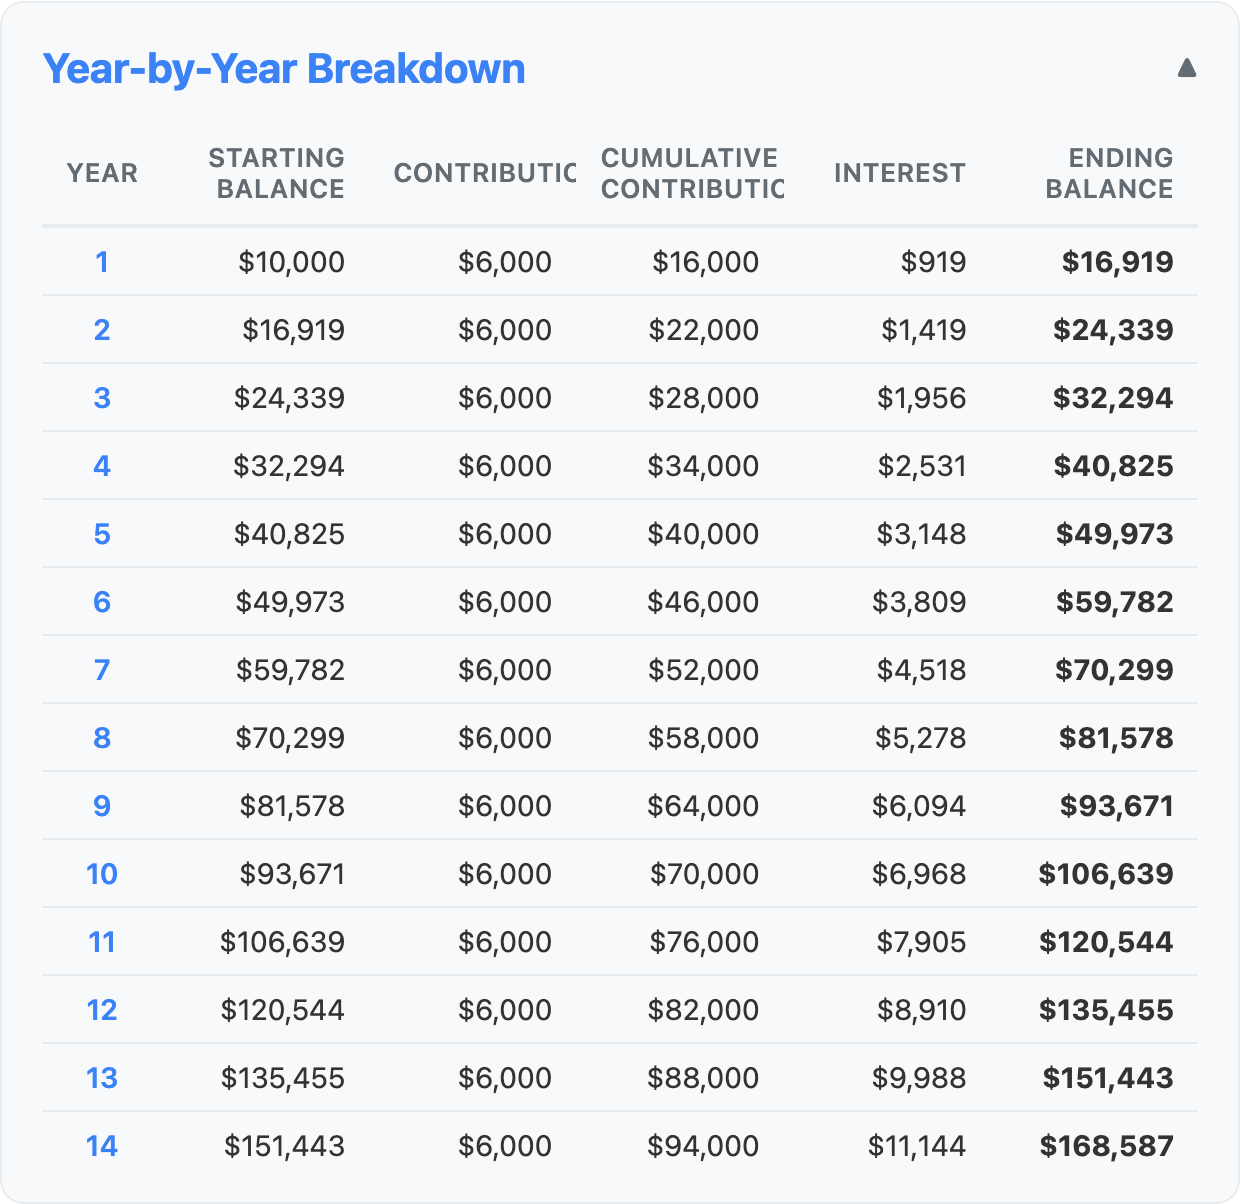
A few things stand out when you scan the table:
- Year 1 interest: $919. On a $10K starting balance, that's barely noticeable next to your $6,000 in contributions.
- Year 10 interest: $6,968. Now interest is earning more per year than a single month's contribution.
- Year 17: the crossover. Cumulative interest ($115,820) finally exceeds cumulative contributions ($112,000). From here on, interest outpaces what you're putting in.
- Year 30 interest: $46,374. In the final year alone, you earn more in interest than you contributed over the first 7.7 years combined.
The crossover year shifts depending on your return rate:
| Annual Rate | Crossover Year |
|---|---|
| 5% | Year 25 |
| 6% | Year 20 |
| 7% | Year 17 |
| 8% | Year 15 |
| 10% | Year 12 |
Higher returns pull the crossover earlier, but even at a conservative 5%, it still arrives within 25 years.
Experiments to Try
Open the Compound Interest Calculator and try these scenarios:
- Double the time. Change from 30 to 40 years. Watch how the last decade adds more than the first three combined.
- Double the contribution. Set monthly to $1,000. The ending balance more than doubles because interest compounds on the higher base.
- Zero initial investment. Set initial to $0. See how far $500/month alone can take you — it's still over $600K.
- Compare frequencies. Switch between annual and daily compounding. The difference exists but is smaller than most people expect.
- Stress test with variance. Set variance to 3% and see how wide the band gets at 30 years. Ask yourself: am I comfortable with the low estimate?
Bottom Line
Compound interest rewards two things above all else: consistency and time. The monthly contribution matters more than the initial lump sum. The number of years matters more than the return rate. And starting earlier always beats starting with more money later.
The best time to start was 10 years ago. The second best time is now.
Run your own numbers with the Compound Interest Calculator. Then see how to split those contributions across tax-advantaged accounts with the Investment Optimizer, or figure out your overall savings rate with the Savings Rate Calculator.